Table Of Content
New in 2026
Quick Guide
Video Guides
Getting Started
UI Design
Var Actor
Edit Scene
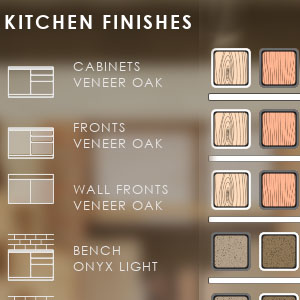
Designer
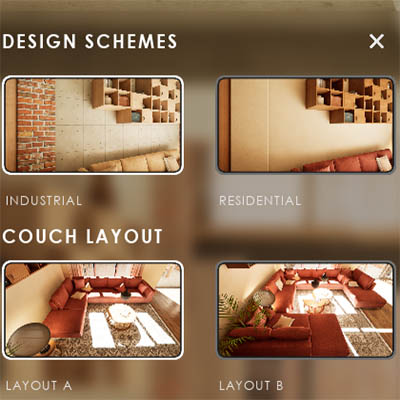
Feat. w. Preview
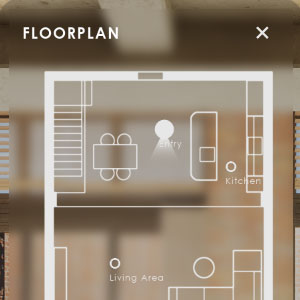
Other Features
Modes
Blueprints

Cost Reports
Multi-Unit-Prj
Google Sheets
FAQ & Tips
Fix Bugs
Updating
Version History
Cost Tracking And Reports
UI3 has built in Cost Tracking that gives the user an estimate of the cost of his choices in the scene.
How to print reports to a file with a free plugin.
Content:
 Documentation Archive 2025
Introduction
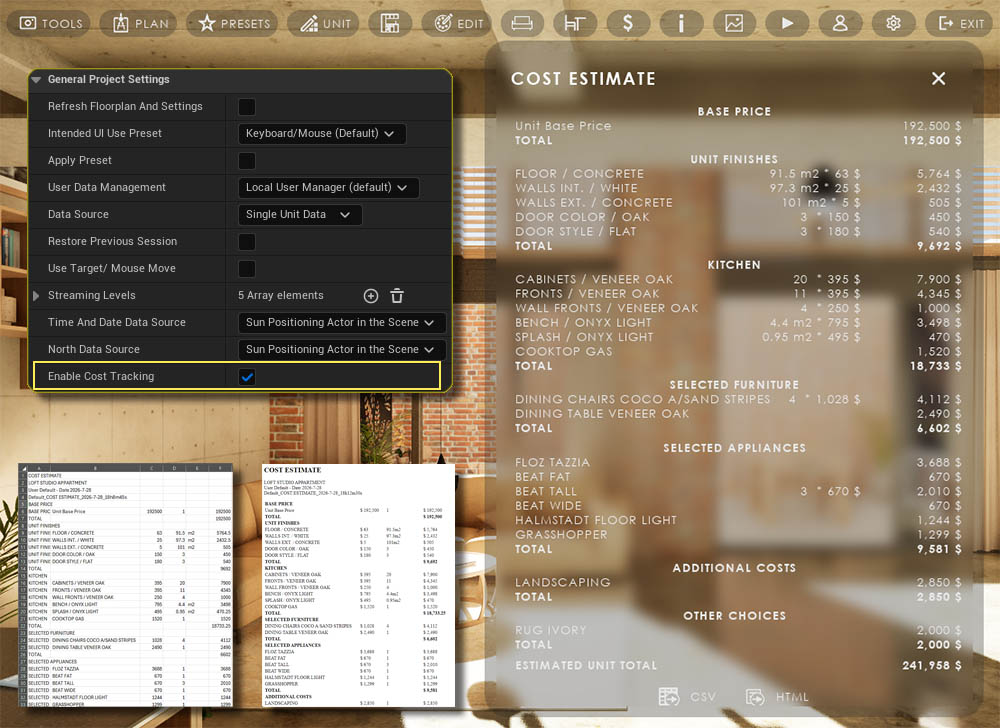
UI3 allows to track the cost of the project. The cost will update when the user makes a change or chooses a different option.
Enable Cost Tracking
Cost Tracking needs to be enabled in the Info Map and in all actors that are relevant to Cost Tracking.
Cost Tracking Widget
The result can be shown in the Cost Tracking Widget.
- Feature Type - Cost Tracking
- Feature ID - None (ignored)
Cost Reports
Two buttons at the bottom of the widget will print the report into the Output Log.
You can install the free plug-in FileSDK to print the report as a file.
Cost Tracking And Reports
Info MapCost Groups and Rooms List
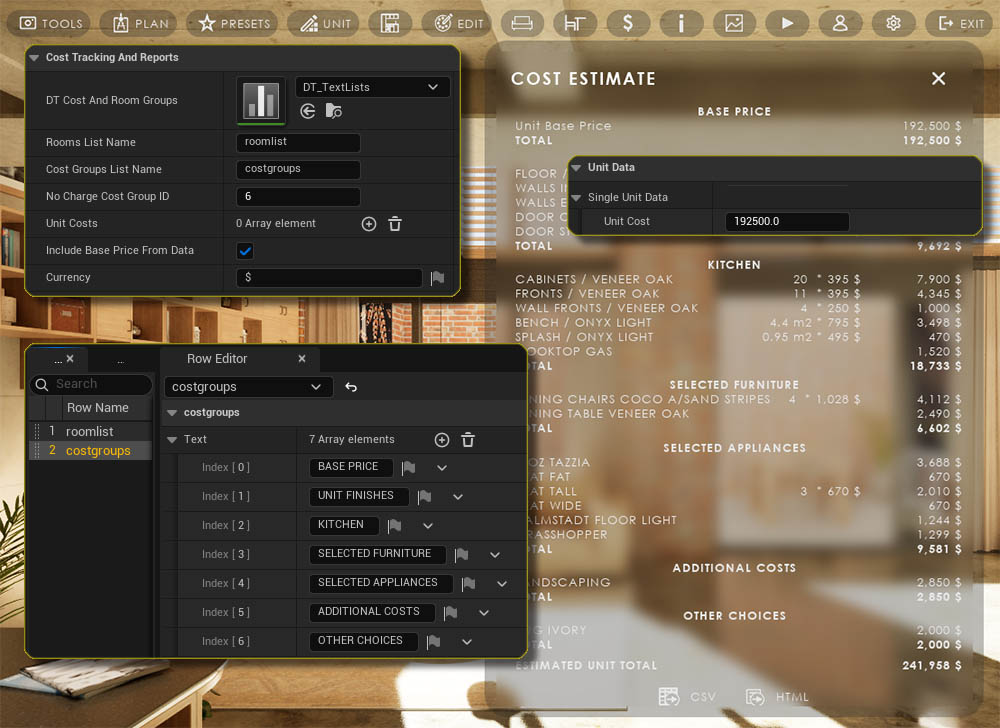
The cost items can be grouped to make the list more readable. Groups are set in the DT Cost and Room Groups data table.
The element ID from the list is then used in the cost item actor.
- Rooms List Name - the row name for a rooms list. Used for inventory lists and not for the cost estimate.
- Cost Groups List Name - the row name for the Cost Groups.
No Charge Cost Group
Cost categorized with this ID will not be added to the total costs.
Include Base Price from Data
The cost set in the Unit Data section will be added as Unit Base Price
Cost Settings in Variation Actor
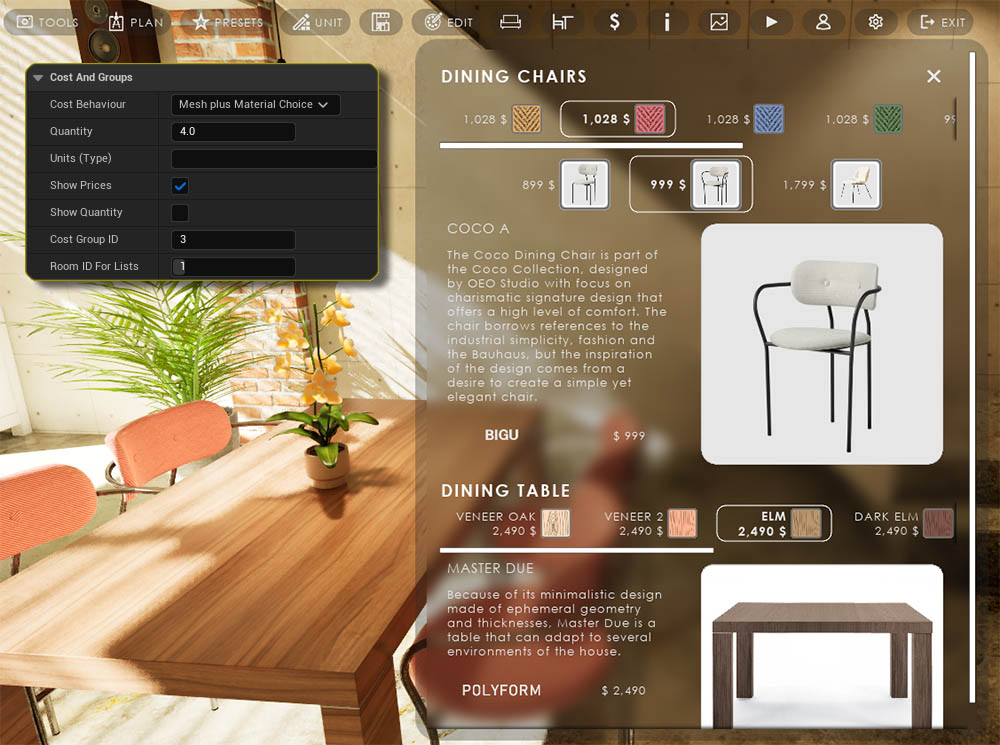
Show Prices
Activate this box to enable cost tracking in an Variation Actor.
Cost Behavior
There are 3 ways to track the cost of the Variation Actor:
- From (Material) Choice - uses the price set in the Choice Button
- From Mesh Choice (Info) - uses the price set for the mesh
- Mesh plus Material Choice - uses the sum of the two
Quantity
How many items there are or the size of the item
Cost Group ID
The ID of the Cost Groups defined in the Info Map
Price in Choices Button
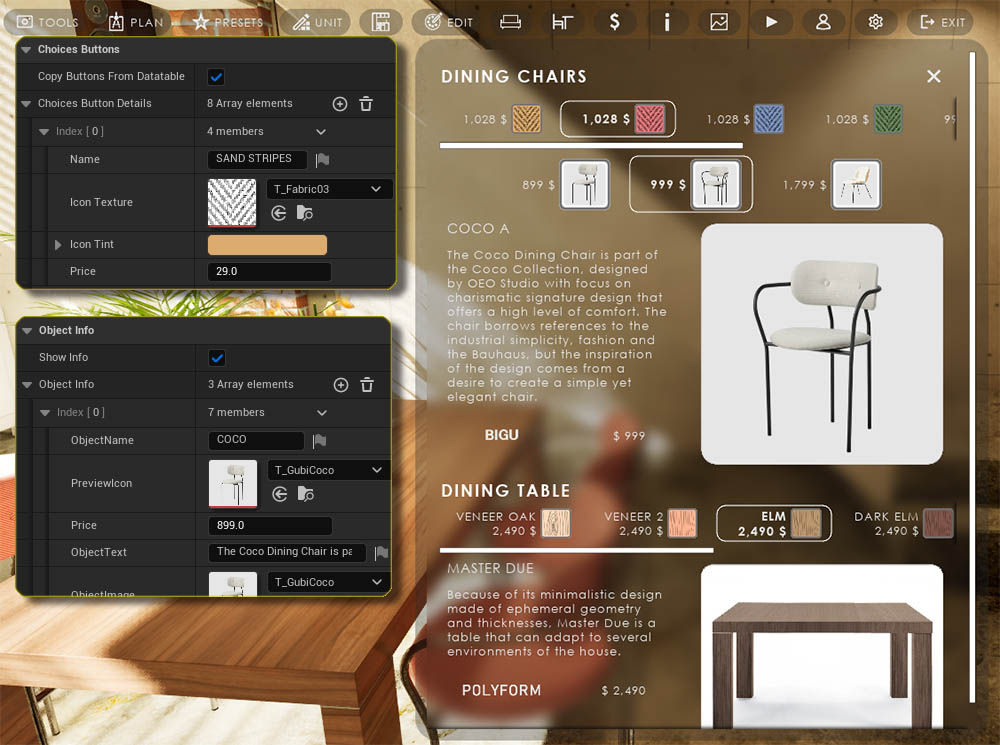
The price will be taken from the Choice Button by default. The choice will be for a material in most cases. It could be for a mesh change, like changing the cooktop from gas to induction.
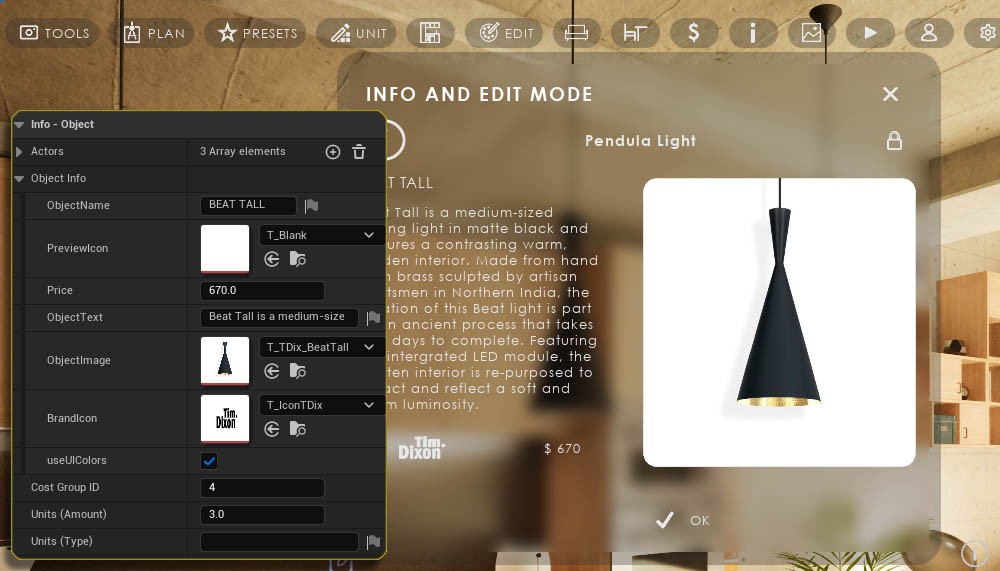
Price in Object Info
The price can be taken from the Object Info section. There are 2 examples in the image:
- Dining Chairs - There are 3 chair models available and each has a different price. The material options also have different prices and the final price is the sum of both.
- Dining Table - The price is set in the Object Info. All material variations have the same price. The Price Behavior is set to From Mesh Choice (Info)
Cost in Object Info
The Object Info is very similar to the Variation Actor but doesn't have the choices logic.
Price
Set the price for one item or unit in the Object Info array.
Cost Group ID
the Cost Group defined in the Info Map.
Unit Quantity and Type
Set the amount, or quantity, of assets and the type
Example: 3 (units), 123.4 m2
Read the page about Multi-Unit Projects to learn how to use the Object Info to mark the units in a building and track their cost.
Cost in Designer
Data Table Designer
Open the data table and select the row for the current Designer.
- Show Prices - Tick the box to activate cost tracking for this designer.
- Cost Group ID - The group ID from the list of groups set in the DInfo Map.
(Use) Element Quantity Overwrites
The quantity set in the element can be overwritten by this array. Sometimes you can re-use an element with only the quantity being different.
 Designer Documentation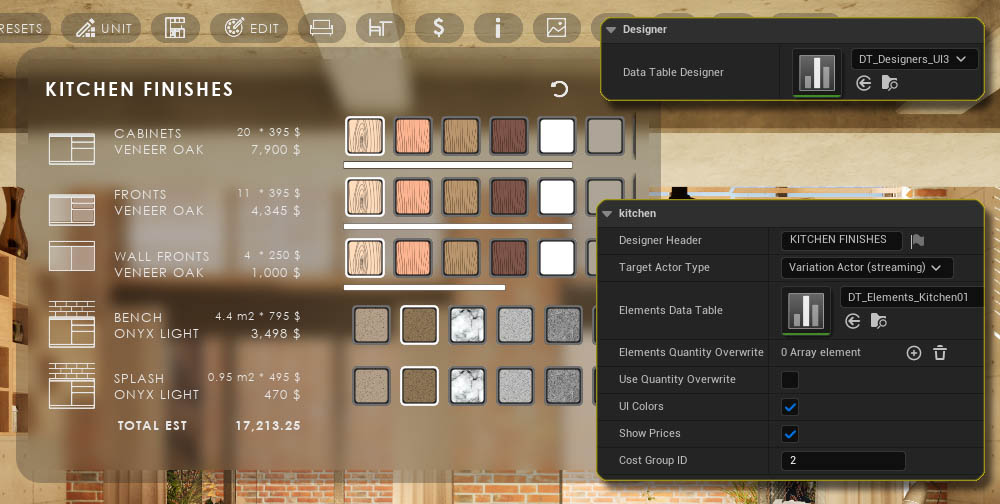
Elements Data Table
The prices are set in the Elements Data Table where each row is an element.
The settings are identical to the ones described above for the Variation Actor.
Target Actor Type (Overwrite)
Gets the quantity from the Variation Actor if the actor is in a streaming level.
Example: the kitchen layout can change in the example scene. The quantities for the kitchen designer elements change between scenarios.
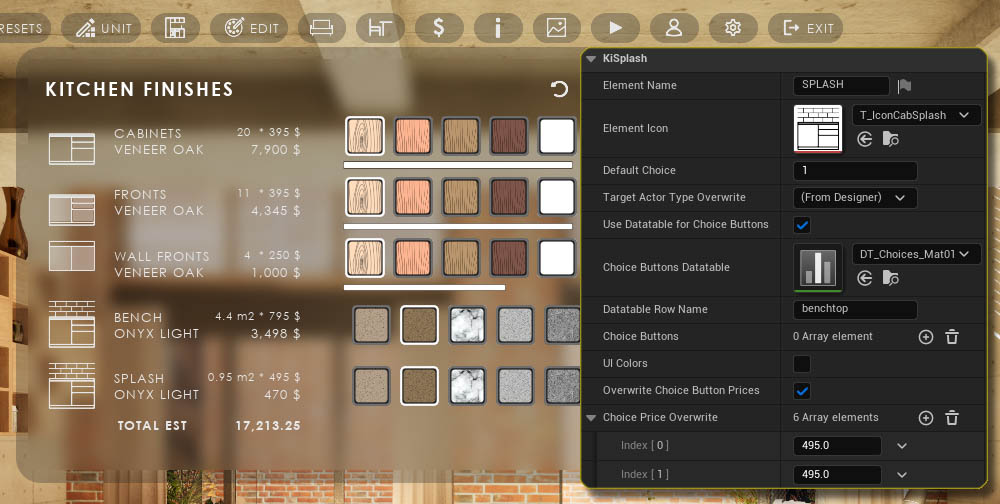
Choice Price Overwrite
Overwrites the prices for the element choices. In cases where the buttons and choices are the same but the prices are different.
Example: the choices for the bench and the splash are identical. The splash is thinner so the cost for the splash is a less. This can be set in the Price Overwrite array.
Cost Group Actor
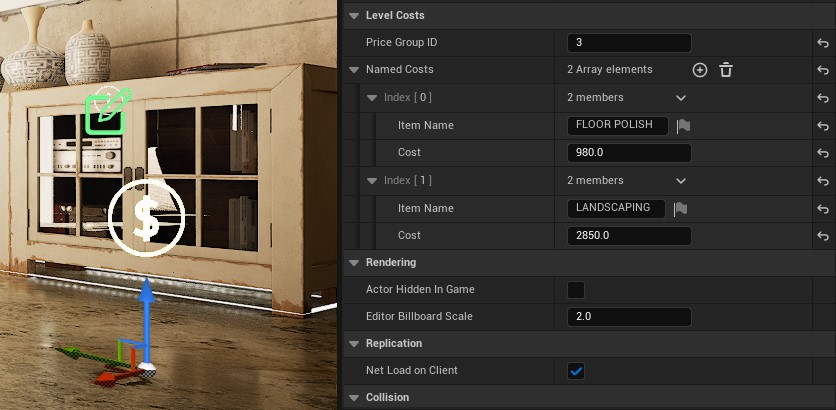
BP_SDotUI3_CostGroup
This blueprint adds cost items to the (sub) level it is placed in. Additional costs for a layout scenario or other level can be tracked with it.
Price Group ID
The ID of the price group defined in the Info Map
Named Costs
Add an array element for each cost item.
Reports
Introduction
The UI3 has a series of built in reports that can be printed to a file. For example
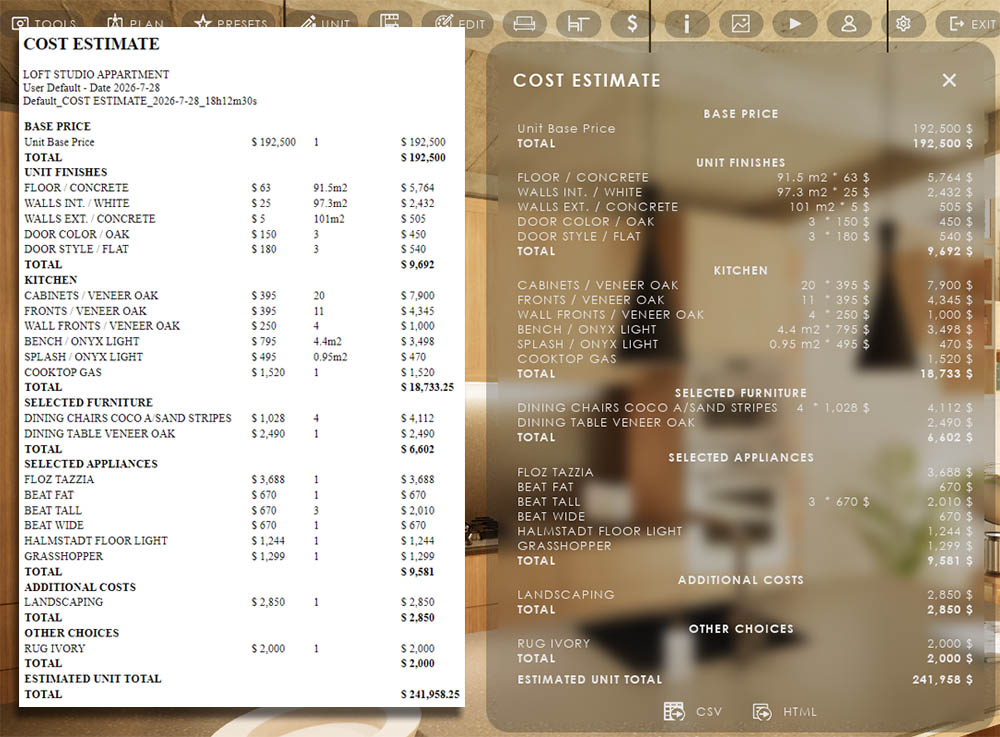
- Cost Tracking Estimate
- Inventory Lists of all items per room
Cost Tracking can be created from the buttons in the Cost Tracking Widget. The image shows a report printed to a *.html file and opened with a web browser.
Adding Reports to the UI
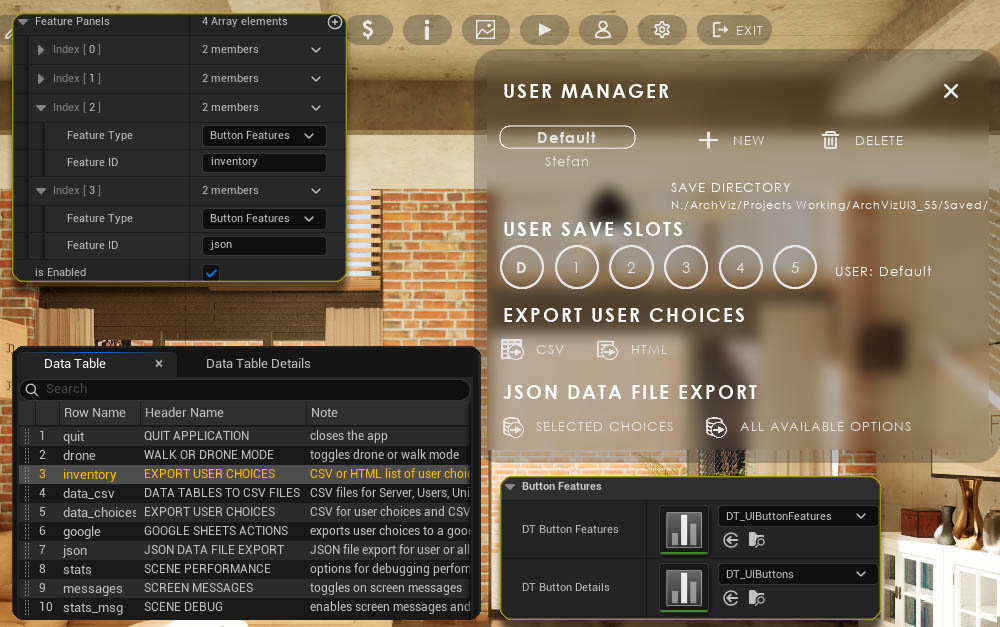
- Feature Type - Button Features
- Feature ID - Row Name of the button feature in the DT Button Features data table.
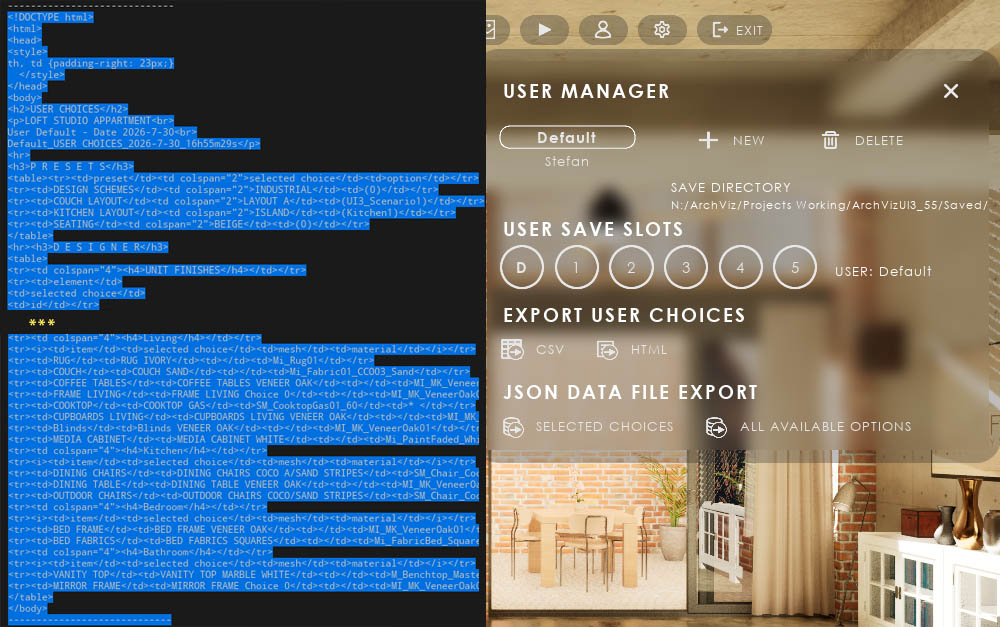
Printing Report to Output Log
The report will be printed to the output log. A html document will look like this
--------------
< !DOCTYPE html >
< html >
< head >
< style >
th, td {padding-right: 23px;}
< /style >
< /head >
< body >
< h2 >USER CHOICES
< p >LOFT STUDIO APPARTMENT< br >
and so on...
< /body >
--------------
Create a report file manually
Further down is a better solution using a free plugin
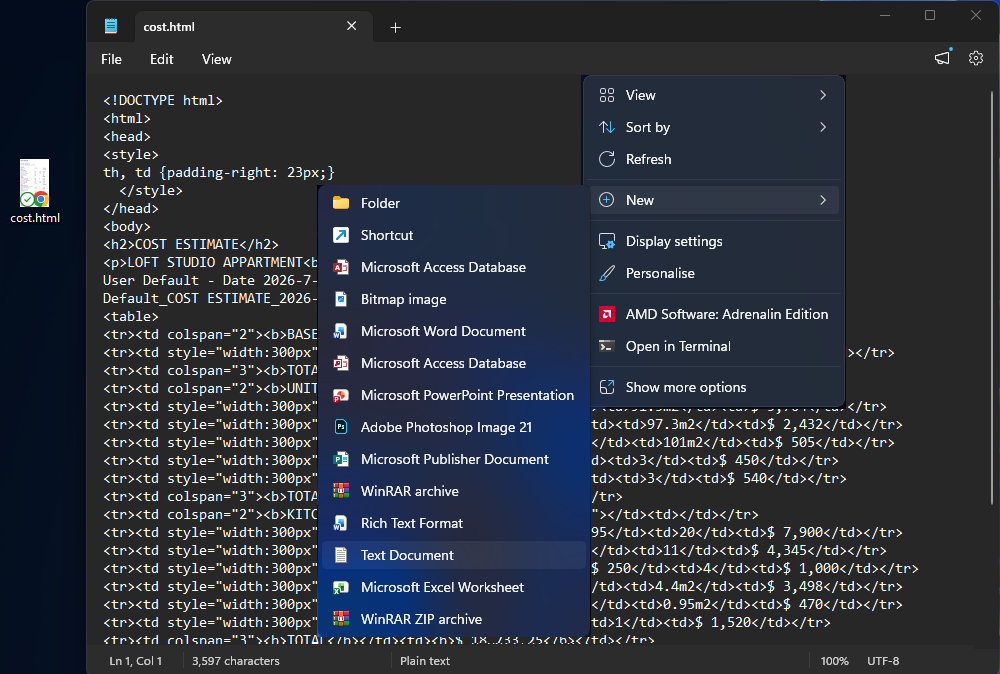
- Select the code in the Output Log between the two dashed lines.
- Copy the code via [CTRL] + [C]
- Right click on an empty spot on the desktop and choose New -> Text Document
- Paste the selected code into the new text document with [CTRL] + [V]
- Save the file
- Rename the file from *.txt to *.html or *.csv or *.json depending on the report type.
Now you can open the file with a double click from the desktop or save it somewhere else.
Use FileSDK Plugin
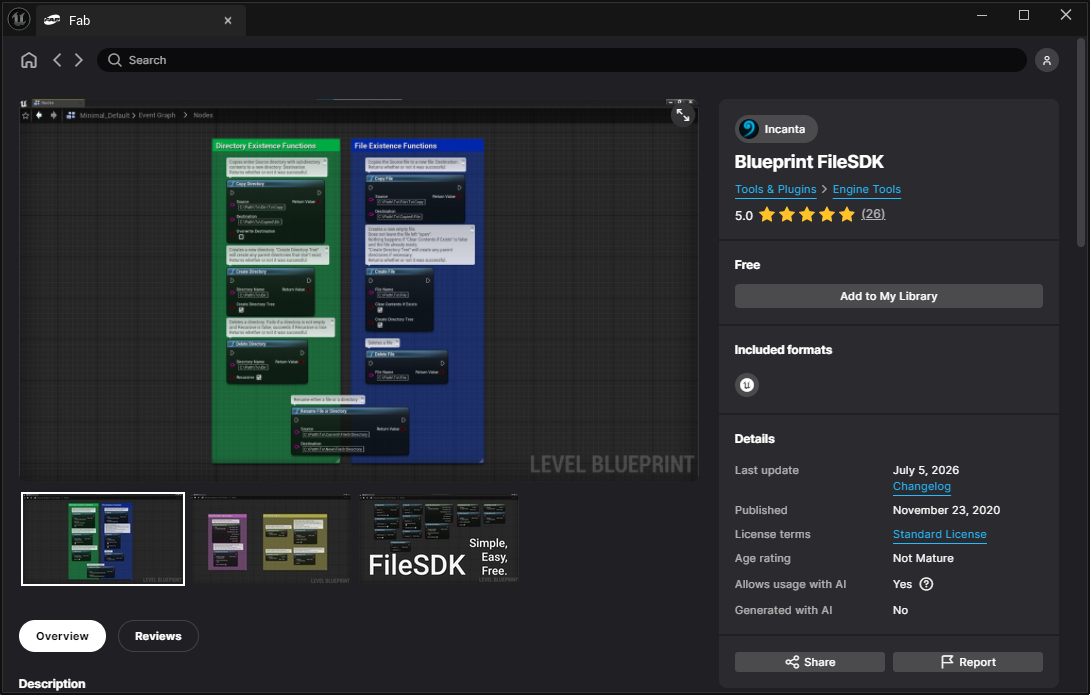
FAB
You can get the free Blueprint FileSDK plugin from the FAB marketplace.
Add it to your library if you haven't already.
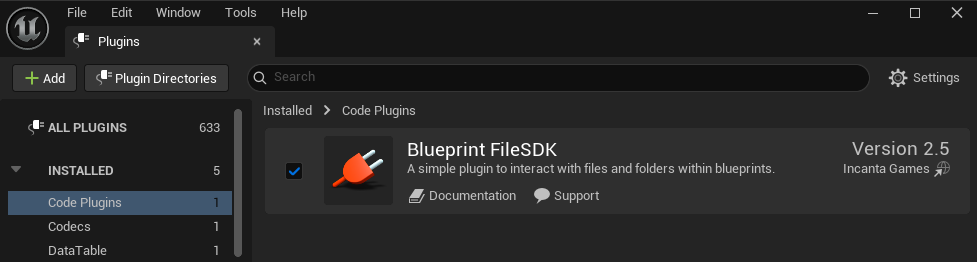
Activate the Plugin
Open the Plugins settings where you also find the Project Settings. Activate the plugin.
Close the Editor and continue with the final step below.
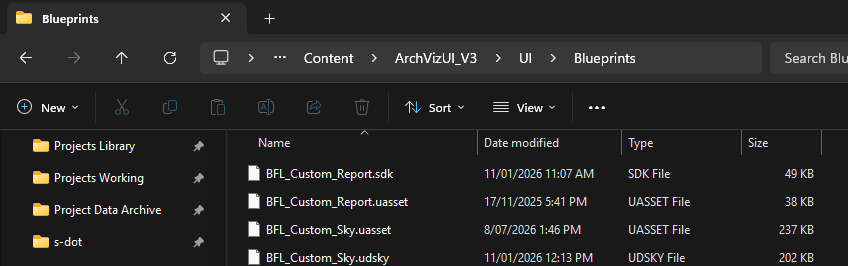
Rename Blueprint Library
Use the Windows Explorer to browse to the project folder
Content / ArchVizUI_V3 / UI / Blueprints
- Rename the BFL_Custom_Report.uasset to BFL_Custom_Report.old
- Then rename the BFL_Custom_Report.sdk to BFL_Custom_Report.uasset
Now the files will be printed to your project Save / Reports folder.
You may have to make the file extension visible in the Explorers View properties to be able to change the files
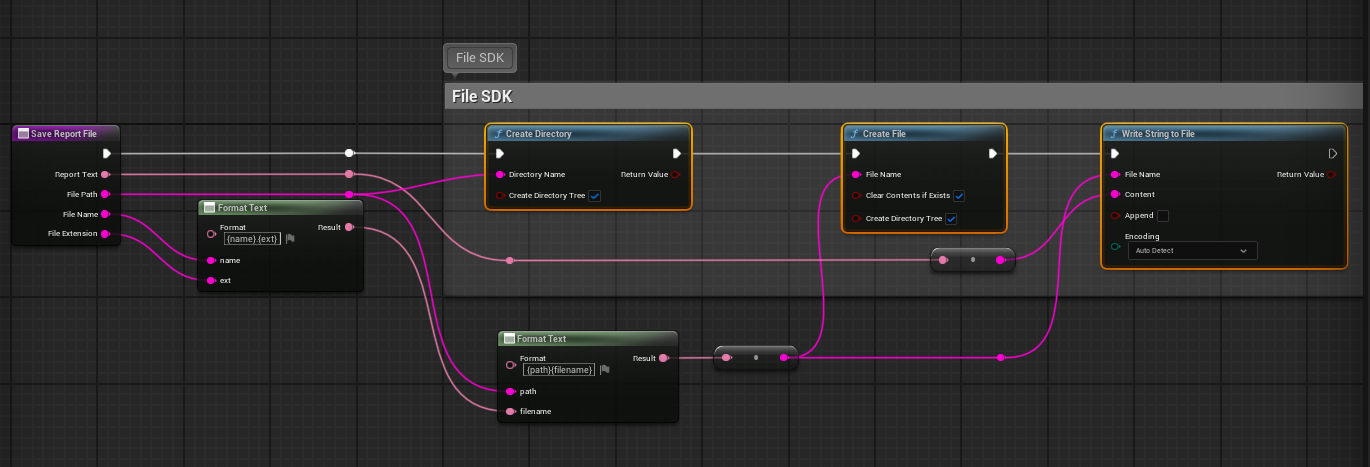
BFL_Custom_Report
The image shows the 3 nodes that are used from the Blueprint FileSDK. This is how it should look after renaming the blueprint library.
- Create Directory - creates the directory from the File Path
- Create File - creates the file from File Name and Extension
- Write String To File - writes the data from Report Text into the file
Other file creating plugins may have slightly different nodes but should work as well.
 Top of page